Introduction
The purpose of this example is the optimization (minimization) of the well-known sphere function using standard Microsoft Excel formulas. The sphere function is one of many test functions that are being used in the literature. In applied mathematics, these test functions, or artificial landscapes, are useful to assess the performance of an algorithm, or a proposed modification of an algorithm.
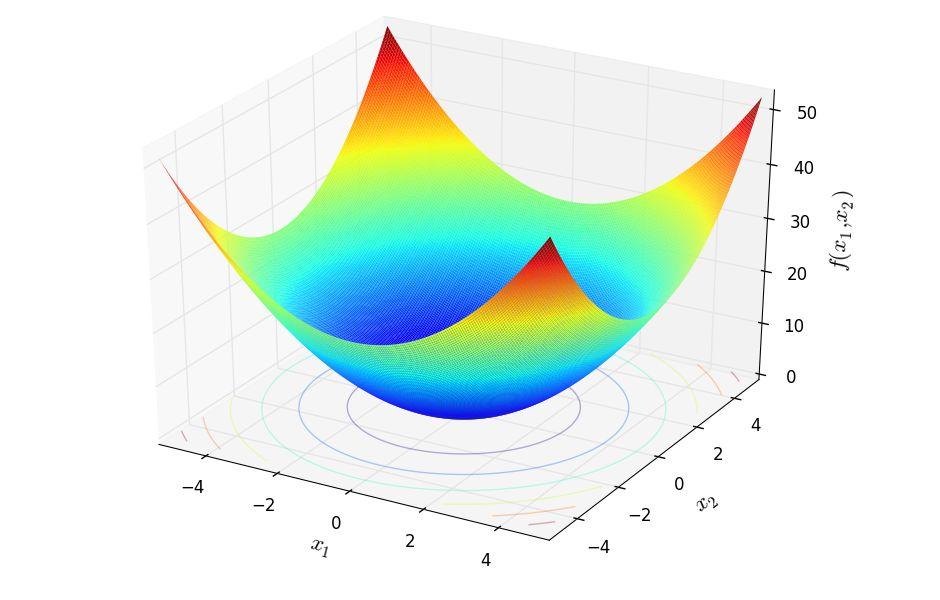
The function is suitable for single-objective optimization, which means that it presents a single objective function. In addition, the sphere function is unimodal. This means that it presents one "mode" and has a single global optimum (e.g. see the picture on the right, which depicts the landscape of a sphere function with two variables, x1 and x2). Note that this function is solved by the classical methods of optimization much faster.
Definition
The sphere function is defined as follows:
Minimize:
\[f\left( {{x_1},{x_2},...,{x_n}} \right) = \sum\limits_{i = 1}^n {{x_i}^2} \]
Due to the mathematical formulation of the function, the global optimum is known a priori:
\[f\left( {0,0,...,0} \right) = 0\]
Setting up and solving the problem is very simple. The steps are described below:
Step 1 : Setting-up the spreadsheet
We begin by creating the spreadsheet. Open Microsoft Excel (in the following images, version 2016 of Microsoft Excel is shown; the process is precisely the same with older versions of Microsoft Excel):

We assume that our problem has 5 variables, i.e. n=5, and each of them takes values in the range -10 to 10. We wish to minimize this expression.
Create a column with the names of the design variables, e.g. DV1, DV2, ..., DV5. In the next column enter their values (initial values are set equal to 1, 2, ..., 5 in the following image). Note that the background of the cells representing design variables is set to bright yellow. In the next column, enter a function which returns the square of the cell on the left, i.e. in cell C2, enter '=B2^2'. Extend this function to the other cells below.

Next, evaluate the sum of the squares in cell D2, by entering the expression '=SUM(C2:C6)'. Add the titles and set the background of cell D2 (the objective function) to e.g. light green.

The final image of the spreadsheet is as follows:

Step 2 : Setting-up the optimization problem
Show the xlOptimizer ribbon in Microsoft Excel:

Select cell D2 (only), which is our objective function. Next, in the ribbon, press the Objectives button. The Objectives list will show up. Press the Add button '+' to add cell D2 in the list of objectives:

In all cases, you can edit the data by selecting the corresponding row(s) and pressing the Edit button in the toolbar. Multiple selection and editing is possible in most cases. The Refresh button updates the cell references if they have been moved (e.g. by inserting or deleting lines in the worksheet). Feel free to save the spreadsheet whenever you like. The optimization data related to xlOptimizer are saved within the same file. If you wish to clear this data from the worksheet, press the Remove data button in the ribbon.
In the ribbon, press the Objectives button again to hide the form. Next, in the spreadsheet, select cells B2 to B6 (those with the yellow background). In the ribbon, press the Design variables button to show the list. Press the Add button '+' to add the selected cells in the list of design variables:

We need to change the lower and upper values of the variables. In the list, select all rows (to include all variables) and press the Edit button in the toolbar. In the Lower bound field, change 0 to -10. Also, change the Upper bound from 1 to 10.

Press Ok to close the form and apply the changes to all selected rows. Also, press the Design variables button in the ribbon again to hide the list.
For this problem, we do not need to define any constraints. Also, the calculations are made using pure Excel formulas, so there is no need to define any calculation macros. We proceed to set up the optimization scenario.
Step 3 : Setting-up the optimization scenario
In the ribbon, press the Scenaria button. Next, press the Add button '+' in the toolbar to add a new scenario. The following form appears:

Make the appropriate selections and press Ok. The scenario is added to the list. In this case, the Standard Differential Evolution algorithm was selected.

The data input is now complete. In the ribbon, press the Scenaria button again to hide the list.
Step 4 : Optimization
In the ribbon, press the Run active scenaria button. The following form appears:

Press the Run. Optimization begins:

The analysis concludes after 20000 function evaluations or after 10 minutes (not probable for such an easy problem) or if you press the Abort button. In any case, Microsoft Excel window pops-up with the best solution that was found (if it was better than the existing one, already present before the optimization).
The file for this example can be found here.

